Predicting Election Results by Scraping Wikipedia Pageview Data
Election forecasters rely on polls, which capture self-reported voting intentions. I demonstrated that passively observed online behavior (Wikipedia pageviews) captures information about voter preferences that polls systematically miss, and that combining behavioral data with traditional polling significantly improves prediction accuracy, especially when polls are at their weakest.
The Insight
Predicting how people will act is one of the oldest challenges in social science. Whether the question is "who will voters choose?" or "which product will users adopt?", the standard approach is the same: ask people what they intend to do. Surveys, interviews, and focus groups all rely on self-reported intentions. And all of them share the same fundamental limitation, which is that we're placing a lot of trust in what people say they'll do. Which, it turns out, is often not what they actually do.
This gap between intention and behavior is well-documented. People change their minds. They tell interviewers what sounds socially acceptable. They express opinions they haven't actually formed. Even genuine, strongly-held intentions are imperfect predictors of action because unforeseen barriers arise (illness, weather, etc.). In elections, this manifests as polling error. It's the persistent, irreducible difference between what polls predict and what actually happens on Election Day.
The core question: If self-reported intentions are inherently limited, can we reduce prediction error by supplementing them with some data on real behavior? Specifically, can the digital traces people leave when they're not being asked anything (the pages they visit, the information they seek) tell us something about their future actions that surveys can't?
A colleague and I investigated this by looking at a behavioral signal that no one had yet incorporated into rigorous U.S. election models: Wikipedia pageview traffic for political candidates. The logic was straightforward. Information-seeking is an active, self-motivated behavior. Nobody forces you to look up a Senate candidate on Wikipedia. And decades of research on selective exposure show that people disproportionately seek out information that aligns with their existing preferences, especially on political topics. So the relative volume of pageviews for competing candidates should reflect something real about the distribution of public interest and engagement. And that might be something that the regular polling data is capturing imperfectly, if at all.
Study Design
Using Wikipedia's API, we scraped pageview data for all major-party candidates across 104 U.S. Senate general election races in 2008, 2010, and 2012. For each race, we gathered daily Wikipedia pageviews for both candidates across the 200 days leading up to Election Day, alongside nearly 2,000 pre-election polls conducted during the same window.
The analytical approach had three layers, each testing a progressively more demanding claim:
Layer 1: Correlation
Is the relative share of Wikipedia pageviews between two candidates correlated with their actual vote share? Tested via bivariate regressions at each day before the election.
Layer 2: Unique Variance
Does Wikipedia data explain variance in election outcomes beyond what polls and fundamentals already capture? Tested via hierarchical regression, entering Wikipedia pageviews after polls and fundamentals.
Layer 3: Error Reduction
Does adding behavioral data actually reduce prediction error in the full synthesized model? Measured as change in root mean square error (ΔRMSE) at each time point.
Benchmark Model
To ensure a rigorous test, I built on the Hummel & Rothschild (2014) fundamentals model: a 20-variable model incorporating incumbency, economic indicators, approval ratings, and more, already explaining ~70% of variance. We wanted to make sure we were benchmarking against the best forecasting models available.
Data Engineering Decisions
Raw Wikipedia pageview counts follow a power-law distribution. Basically, a few candidates attract massive traffic while most receive very little. Using raw counts to compute a "share of pageviews" variable produced a nearly flat distribution and violated the normality assumptions required for OLS estimation. Diagnostic plots confirmed a curvilinear relationship between the raw pageviews variable and the regression residuals, indicating model misspecification.
We applied a natural log transformation to the pageview counts before computing the share variable, which corrected the distributional issues (Shapiro-Wilk tests confirmed normality was a reasonable assumption after transformation) and resolved the curvilinear residual pattern.
Handling Missing Data
Not every race had polling data at every time point (only 59% of races were polled 28 weeks out), and not every candidate had a Wikipedia page for the full cycle. Rather than dropping races with missing data, which would bias the sample toward competitive, well-covered races, we used an imputation strategy based on the prior forecasting research. That is, when one data source was missing, the fundamentals-based projection filled its place. Multicollinearity diagnostics (VIF) and autocorrelation tests (Durbin-Watson) confirmed this approach didn't violate model assumptions.
Results
1. Wikipedia Pageviews Predict Vote Share
The share of ln-transformed Wikipedia pageviews was significantly correlated with vote share at every one of the 200 days before the election (all p < .001). The variance explained ranged from 36% to 49%, with the strongest prediction roughly one month before Election Day. This confirmed the basic premise: the candidate whose Wikipedia page attracts more traffic relative to their opponent tends to get more votes.
2. Behavioral Data Explains What Polls Miss
The critical test was whether Wikipedia data explained unique variance, not just variance that polls were already capturing. Using hierarchical multiple regression, we entered the fundamentals-based projection and the poll-based projection at step one, then added the Wikipedia pageviews projection at step two.The result: at 13 of 14 biweekly checkpoints across the 28-week window, Wikipedia pageviews explained a statistically significant amount of additional variance beyond what polls and fundamentals already accounted for. The sole exception was 20 weeks before the election, where the effect was marginal (p < .10), likely because primary season activity distorted the pageview signal at that point.
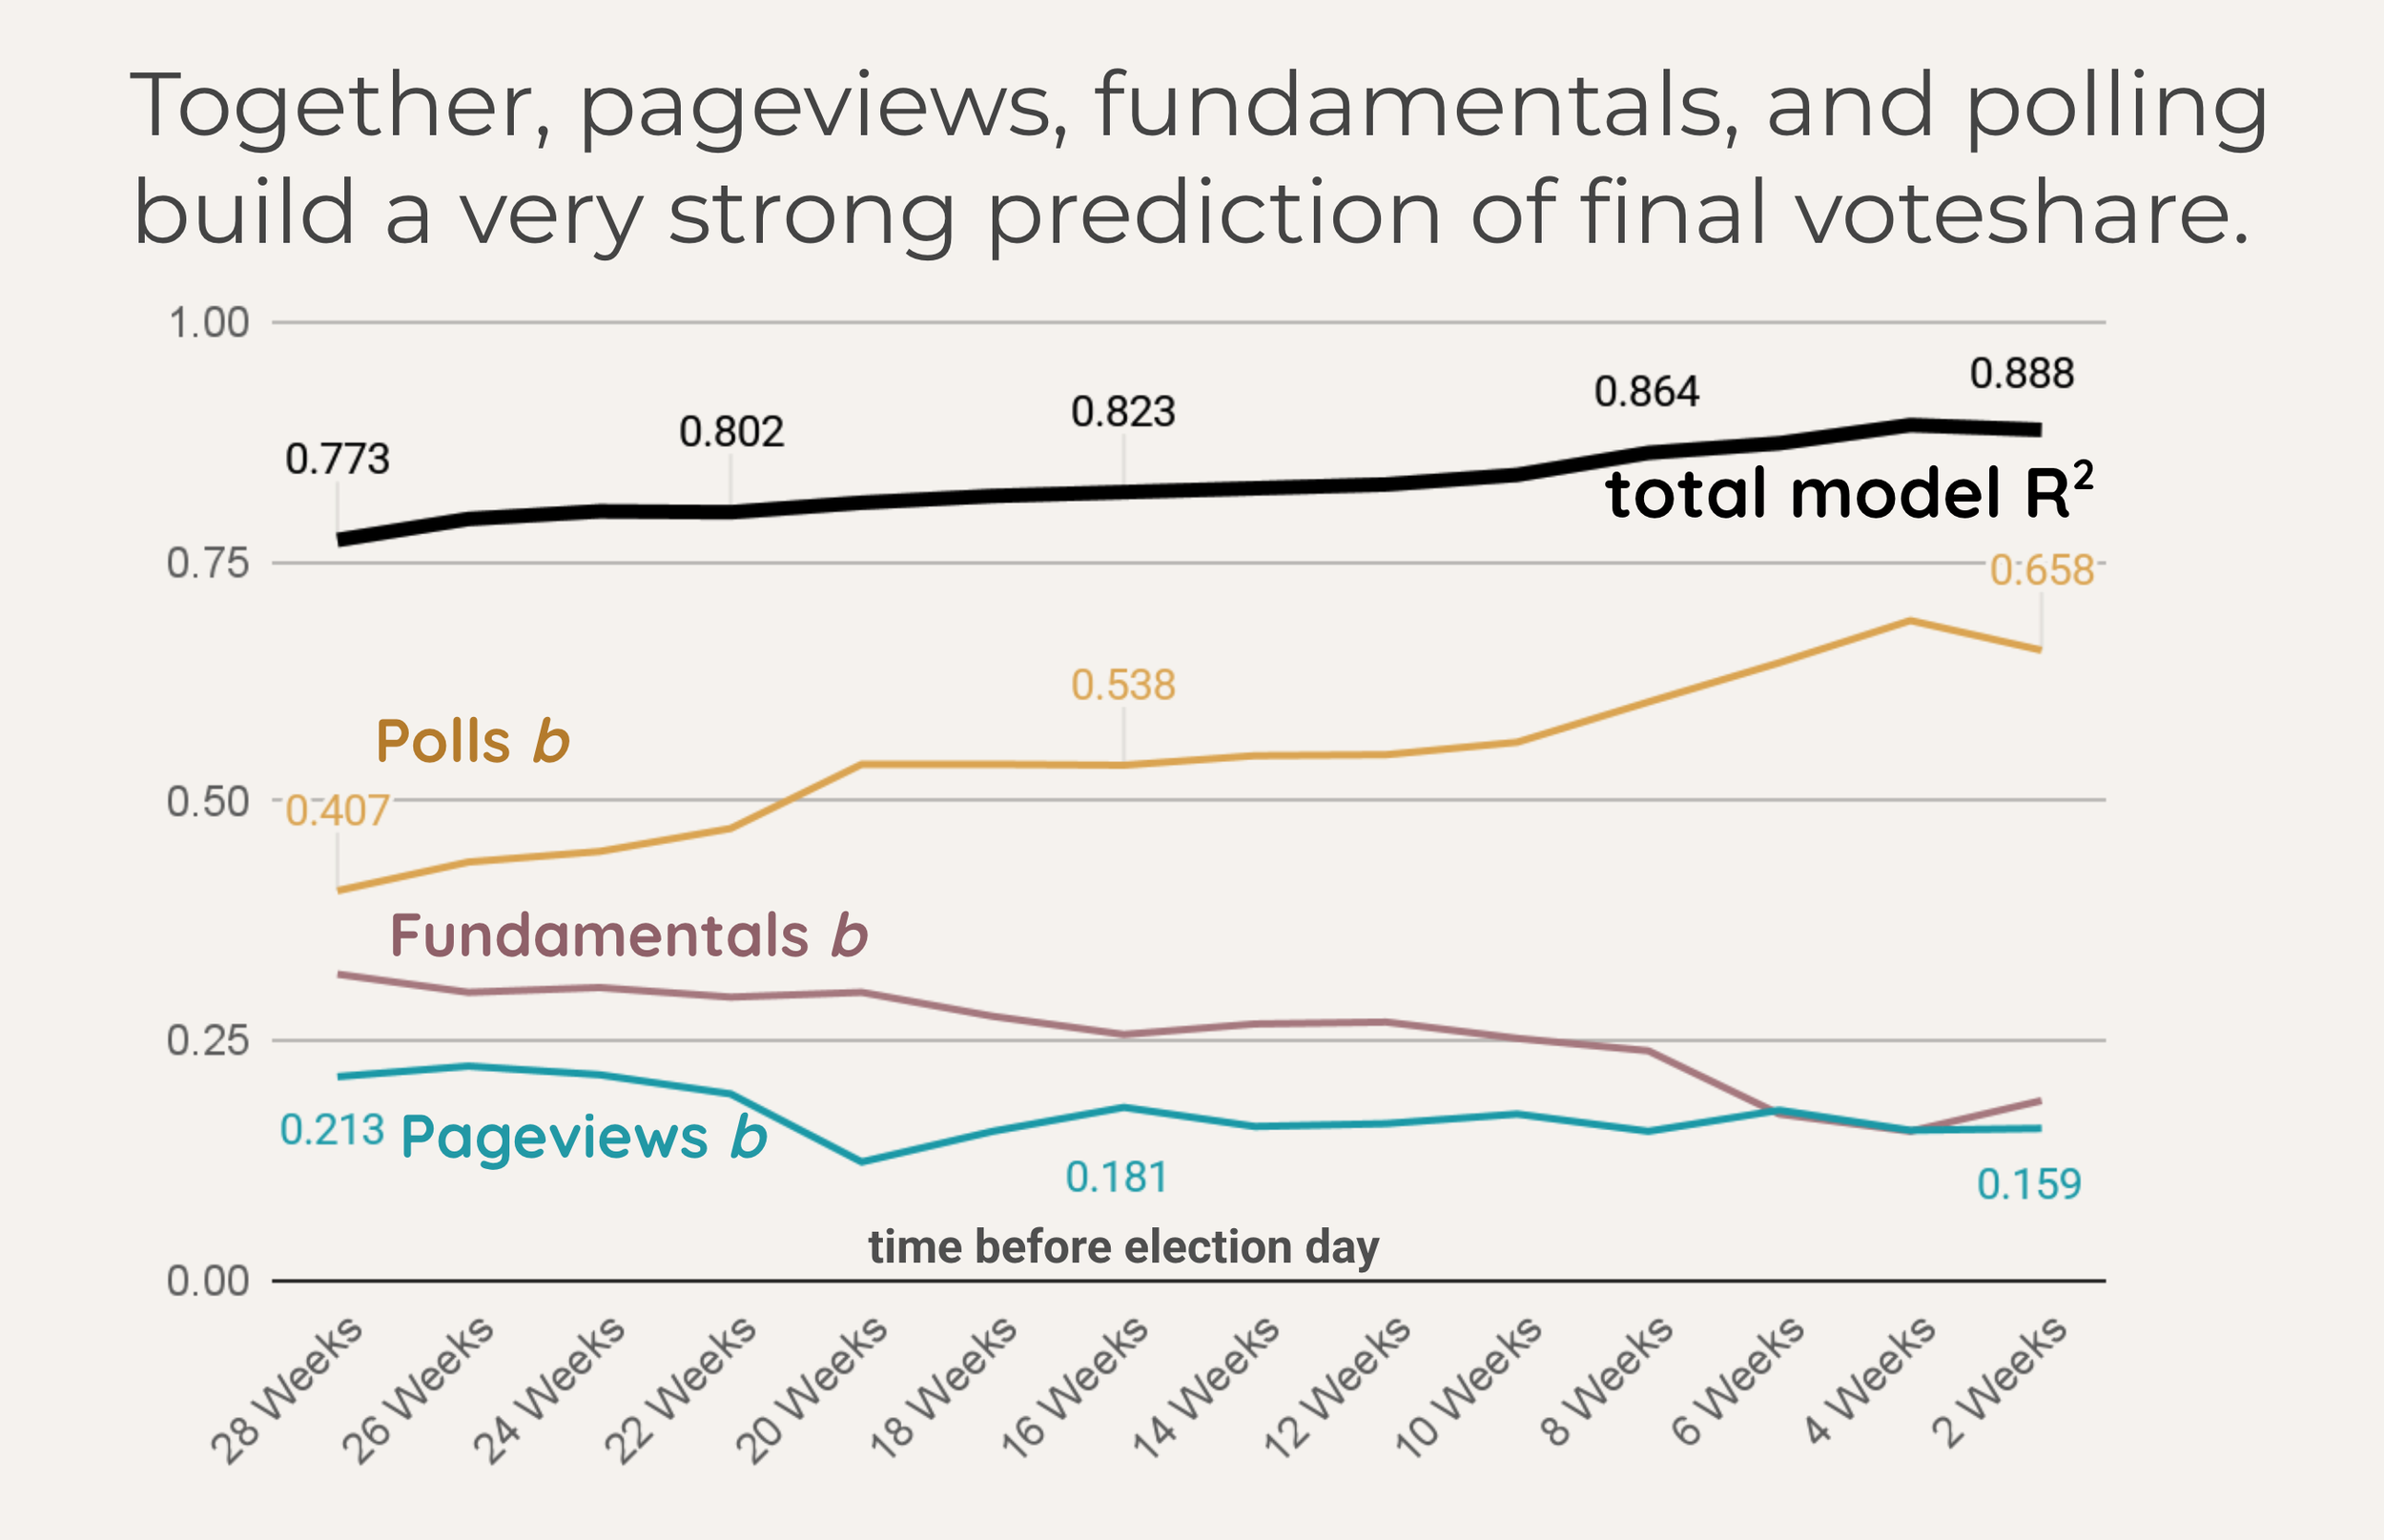
The full synthesized model (combining fundamentals, polls, and Wikipedia pageviews) explained up to 89.3% of variance in vote share, compared to 88.3% for fundamentals and polls alone. The improvement was consistent and statistically significant across nearly the entire 28-week window.
3. The Biggest Gains Come When Polls Are Weakest
Election forecasts live and die by percentage points. When a model projects a candidate to win 53% of the vote and they actually get 51%, that's a 2-point miss. The root mean square error (RMSE) captures this: it's the typical size of the gap between what the model predicted and what actually happened, measured in those same percentage points. A model with an RMSE of 6.0 is, on average, about 6 points off. An RMSE of 4.5 means the model is typically within 4.5 points of the real result.
So when we look at how much the RMSE changes after adding Wikipedia pageviews to the model, we're asking a very concrete question: how many percentage points closer to reality did the predictions get? At 26 weeks before the election, adding behavioral data shrank the typical error by a quarter of a point. That may sound small in isolation, but in a field where forecasters fight for tenths of a point of accuracy, and where the baseline model is already explaining over 75% of the variance, squeezing out an additional quarter-point improvement from a single new data source is a meaningful gain.
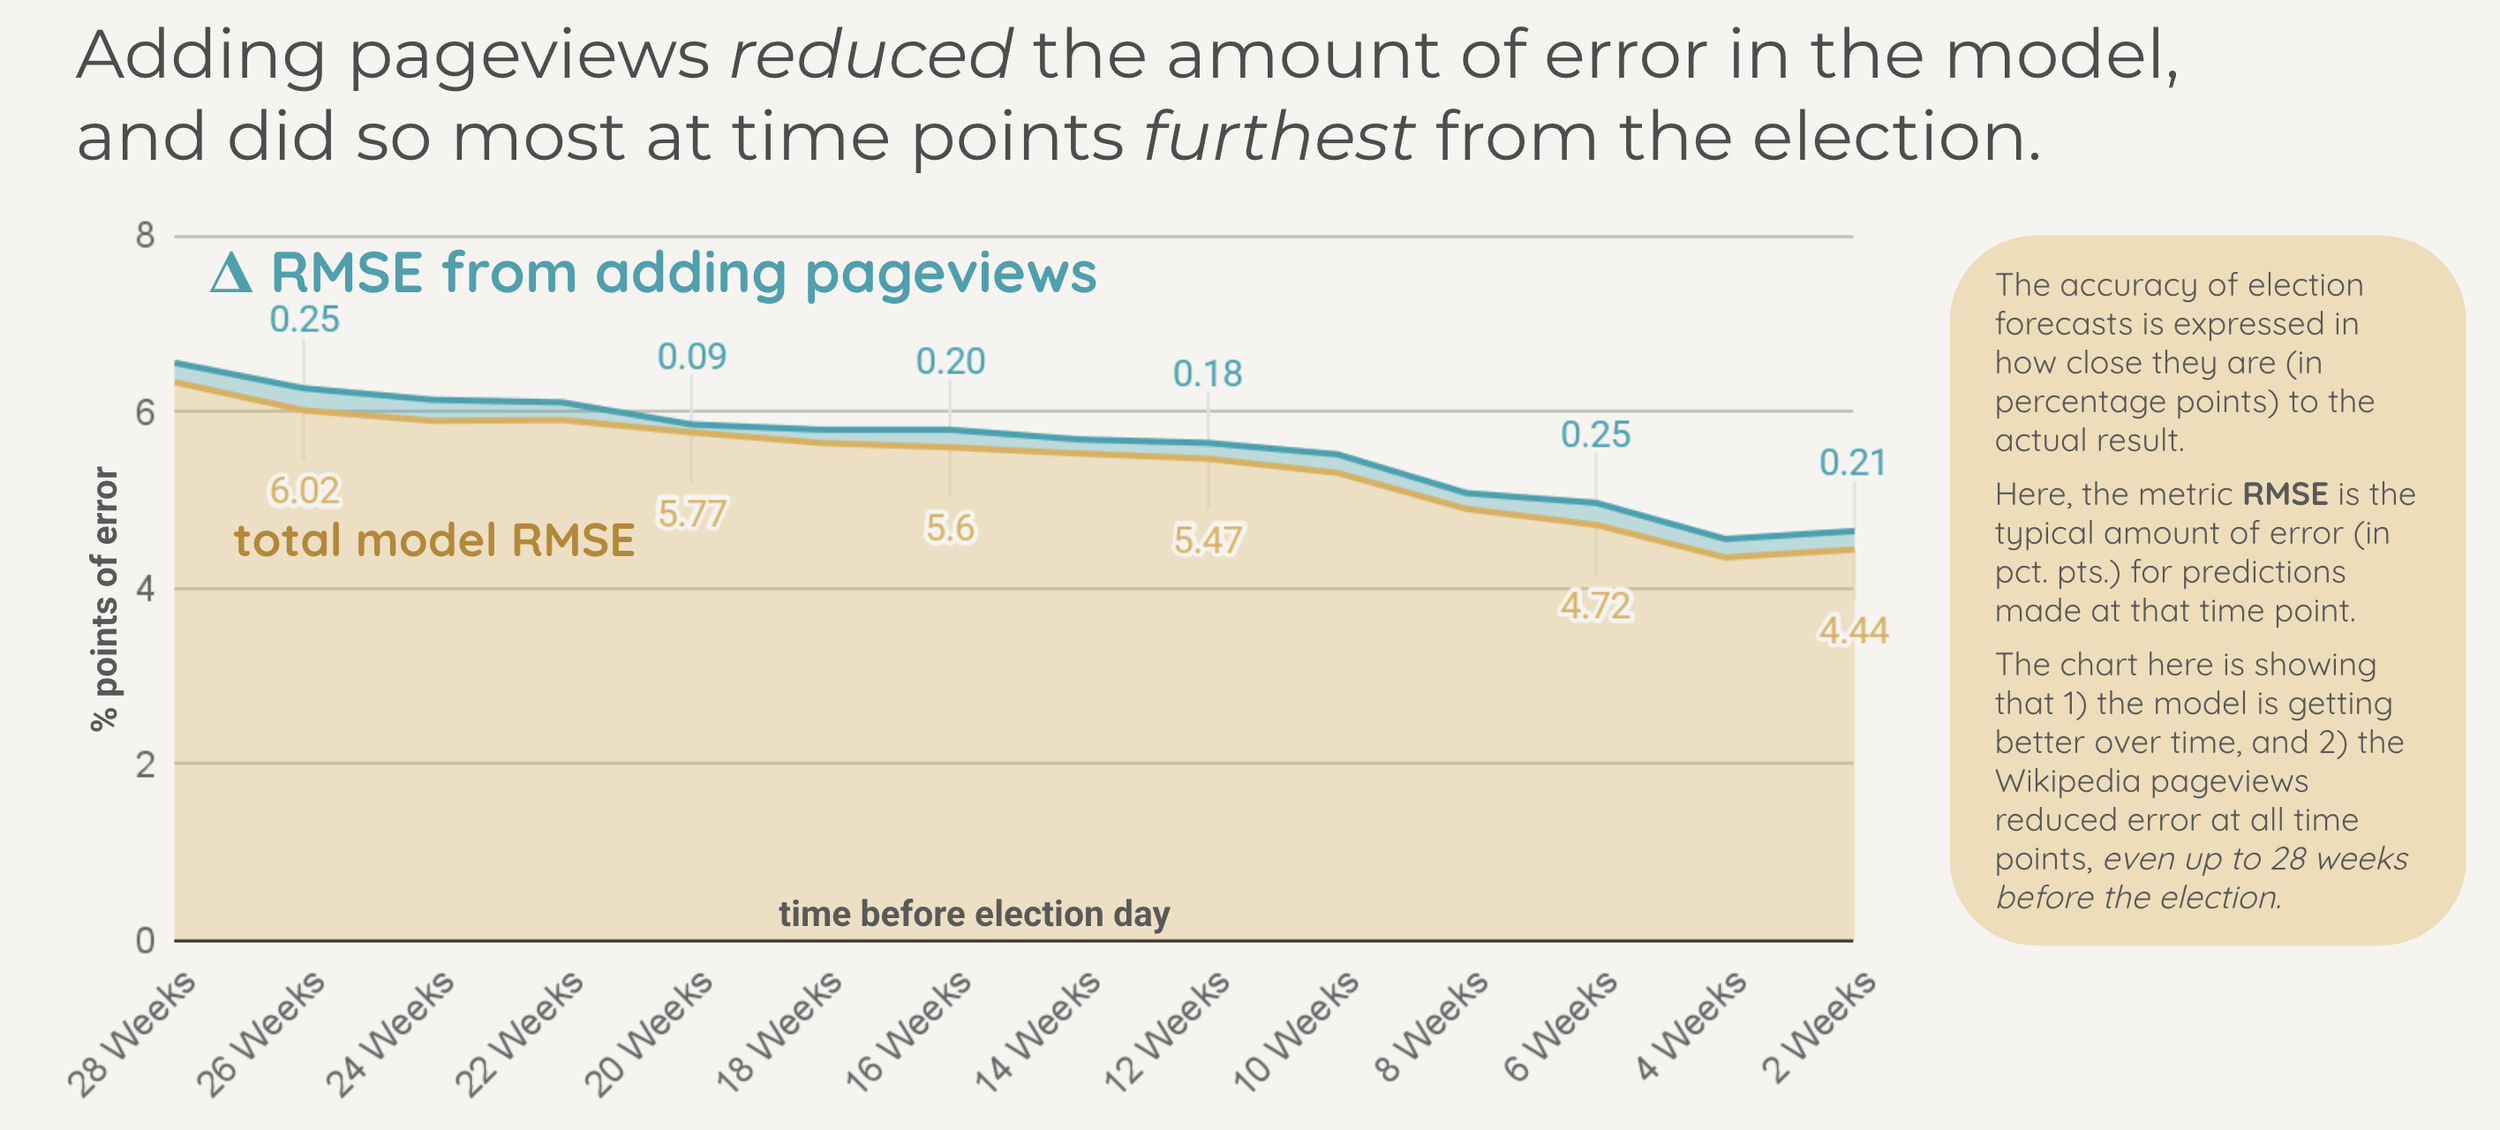
This was the most practically important finding (imho). The improvement from adding behavioral data wasn't uniform across the election cycle. The benefit was actually largest at the points furthest from Election Day, precisely when polling data is sparsest and least reliable.
Early in the Cycle (28 to 20 weeks out)
Polls are available for only ~60% of races. The ones that exist are noisy, with wide margins of error. Wikipedia pageviews provided the largest incremental improvement here, with ΔR² values of .013 to .018 and RMSE reductions of 0.20 to 0.25 points.
Late in the Cycle (6 to 2 weeks out)
Polls are available for 90%+ of races and are much more accurate. Wikipedia pageviews still provided a significant improvement, but the increment was smaller (ΔR² of .010 to .014), because there was less error left to explain.
This pattern makes intuitive sense. Early in an election cycle, public opinion is still forming. Many voters haven't been polled, and those who have may not yet have firm intentions. But information-seeking behavior is already happening. People are already looking up candidates, reading about them, forming impressions. The behavioral signal is ahead of the self-report signal.
The practical implication: behavioral data is most valuable precisely when traditional research methods are least reliable, early in a decision process, before preferences have crystallized and before there's enough self-report data to work with.
Why This Matters Beyond Just Elections
This study was published in the scientific journal Public Opinion Quarterly and framed as a contribution to election forecasting methodology. But I think the underlying principle extends well beyond politics. The core finding is about a general property of human behavior research, which is that observed behavior captures information about future actions that self-report measures systematically miss.
Self-report and behavioral data are complementary, not redundant. Polls and Wikipedia pageviews were both correlated with election outcomes, but they weren't capturing the same signal. Each explained variance the other missed. The strongest predictions came from combining both, not from choosing one over the other.
Passively observed behavior circumvents the biases of self-report. Surveys are subject to social desirability, hypothetical bias, and the intention-behavior gap. Behavioral traces (page visits, search queries, engagement patterns) reflect what people actually do when no one is asking. They're unobtrusive, autonomous, and self-motivated.
Behavioral signals are most valuable early in a decision process. When stated preferences are still soft and survey data are sparse, behavioral signals are already accumulating. This means they provide the most incremental value at the moments when traditional methods are least informative, exactly when better data is most needed.
These principles apply directly to product and user research. A team relying solely on survey data to predict adoption, churn, or feature preference is leaving signal on the table. Behavioral analytics (clickstreams, search patterns, feature usage, time-on-page) carry information about user intent that attitudinal surveys don't fully capture. And just as this study showed for elections, the gap between what behavioral data reveals and what self-report captures is likely widest in early-stage research, when users' preferences haven't fully formed and survey responses are most uncertain.
Methodological Reflection
This study has a significant and clearly stated limitation: it's calibrated in-sample rather than tested out-of-sample. Because Wikipedia pageview data were only available for three election cycles at the time, there wasn't enough prior data to calibrate the model on one set of elections and validate it on another. The results should be read as evidence that Wikipedia pageviews can improve forecasts, not as a validated forecasting system. A true test would involve using parameters from these elections to predict a subsequent cycle, something future researchers with more data could pursue.
The study also can't distinguish the location or eligibility of Wikipedia page viewers. A candidate's page might attract traffic from out-of-state interest, media attention, or controversy rather than constituent engagement. The Todd Akin case in 2012, where a controversial remark sent his daily pageviews from 176 to over 90,000, illustrates how viral moments can distort the behavioral signal. At scale, these outliers wash out, but they're a reminder that behavioral data carries noise alongside signal.
What I'd Do Differently Now
With more election cycles now available, the natural extension is proper cross-validation: calibrate on a subset, predict out-of-sample, and assess genuine forecasting accuracy rather than in-sample fit. And I'd want to incorporate sentiment or directionality into the behavioral signal. That is, maybe we could find a way to measure not just whether people are looking up a candidate, but the context that drives the search (positive curiosity vs. scandal-driven attention).
The broader methodological takeaway is that behavioral data and self-report data have different strengths, different failure modes, and different blind spots. The strongest research designs triangulate with different methods, using each to compensate for the other's weaknesses. That's what the synthesized model in this study does, and it's a principle I've carried into every research project since.
Smith, B. K. & Gustafson, A. (2017). Using Wikipedia to predict election outcomes: Online behavior as a predictor of voting. Public Opinion Quarterly, 81(3), 714-735. doi:10.1093/poq/nfx007